
This post is the first post in the series, and it focuses on logging best practices for Lambda functions using AWS CloudWatch and Powertools for AWS.
What makes an AWS Lambda handler resilient, traceable, and easy to maintain? How do you write such code?
In this blog series, I’ll attempt to answer these questions by sharing my knowledge and AWS Lambda best practices, so you don’t make the mistakes I once did.
I’ll provide a working, open-source AWS Lambda handler template Python project.
You can find all examples at this GitHub repository including CDK deployment code.
This handler embodies Serverless best practices and has all the bells and whistles for a proper production-ready handler. I’ll cover issues such as logging, tracing, input validation, features flags, dynamic configuration, and how to use environment variables safely.
While the code examples are written in Python, the principles are valid to any supported AWS Lambda handler programming language.
Most of the code examples here are from the excellent AWS Lambda Powertools repository. I’ve written several of the utilities mentioned in this blog series and donated 2 of them, the parser and feature flags, to AWS Lambda Powertools.
- This blog series progressively introduces best practices and utilities by adding one utility at a time.
- Part 2 focused on Observability: monitoring and tracing.
- Part 3 focused on Business Domain Observability.
- Part 4 focused on Environment Variables.
- Part 5 focused on Input Validation.
- Part 6 focused on Configuration and Feature Flags.
- Part 7 focused on how to start your own Serverless service in two clicks.
- Part 8focused on AWS CDK Best Practices.
The Starting Point
A lambda handler my_handler receives an input of a dictionary event and an object of lambda context. It returns a JSON response. Written below is the basic AWS Lambda handler seen in many AWS code examples.
The Logger

The first utility might be the most straightforward of them all. Usually, the first instinct is to use Python’s built-in print function as your logging solution. However, You shouldn’t. Python has a built-in logging library. A logger class provides a simple API that adds visibility and debugs information to your AWS Lambda service.
With that being said, I strongly advise that you use the AWS Lambda Powertools’s logger implementation instead. It’s a wrapper of Python’s logging library that provides extra capabilities such as JSON output configuration (and many more).
Why does JSON output format matter?
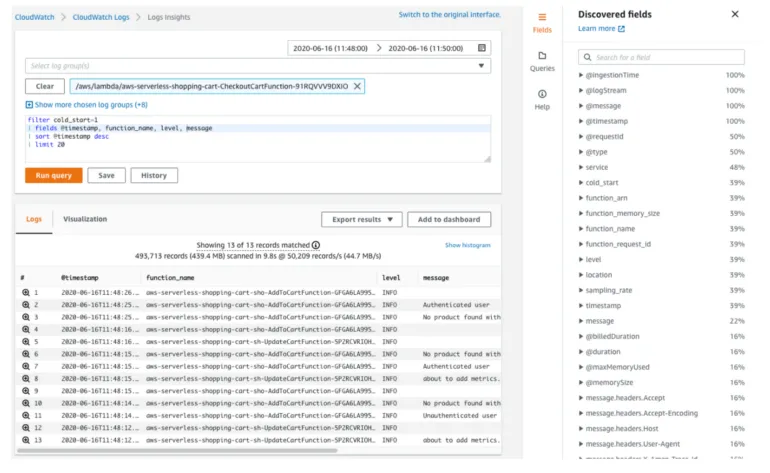
By default, all AWS Lambda logs are sent to AWS CloudWatch (assuming you provide your AWS Lambda with the required permissions). Storing the logs in one place is excellent. However, efficient debugging requires free text search capabilities.
AWS Services such as AWS CloudWatch Logs Insights index your logs and provide an easy free-text search. 3rd party services can do that; DataDog and Logz.io come to mind. These services ease the debugging experience and help you find the problems faster.
However, you can harness the full power of these search engines only when you use JSON structured documents (instead of single-line strings).
Let’s review the example below, where the same log message is written in both string and JSON formats.
JSON-based documents allow you to keep data in a more structured and organized manner, search for inner hierarchy items(event_list[0] or user_data.company), and have non-string data types (int, bool, dict, list). This, in turn, allows you to create dashboards and calculated metrics that provide better visibility and insights into the current state of your AWS Lambda handler.
Putting it all together
The example below demonstrates how to use the AWS Lambda Powertools logger:
In line 8, we create the logger.
In line 12, we set the AWS request_id as the correlation id, which will be added to any following log from that point automatically. Correlation id allows you to find all logs corresponding to a single request across multiple services and executions, as long as the services along the way log it and pass it in the same manner. It dramatically eases the debug process for a single request.
AWS request_id is a unique identifier that will allow you to pinpoint a specific lambda execution out of the many executions of your AWS Lambda. AWS CloudWatch will write all executions’ logs under the same AWS Cloudwatch log group, so having a unique identifier must. You can read more about it in the AWS serverless API logging blog post.
Line 13 prints a JSON log with a debug level, and the message field equals ‘my handler is called.’
You can read more about the logger in the Powertools Logger documentation and the Lambda Powertools best practices blog post.
Rule of Thumb

- Do not, I repeat, do NOT log the contents of the event parameter or any other input your AWS Lambda receives as a whole. You might be logging PII — ” Personal Identifiable Information” (I.D number, phone number, etc.). You might be breaking regulations such as GDPR without even knowing it. That is why it’s critical to log only parameters you trust to lack PII data or strip them from PII before logging them. You can read more about it in the PII and personal data guide.
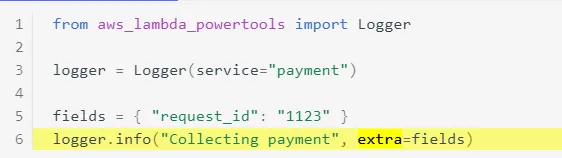
- Keep your log message static. This is the message that you will most likely search for. When you add dynamic (variables value) to the log message, it becomes impossible to know what to look for in AWS Cloudwatch Logs Insights. Log the values of the variables in the extra section of the logger. In this example, “Collecting payment” is a generic statement, while the dynamic data is printed in the extra dictionary field. See more examples in the Powertools Logger extra parameter documentation.
- Log at the start and end of any function. The more logs you have, the easier it gets to understand the root cause of an error.
- Log an error each time an exception is caught. Add as many details as possible without exposing PII.
- Be specific with the log message. You need to be able to understand the message and the context on its own without having to read 20 other logs before that log.
- Make sure to always use the same keys in the logger extra section to make lookup easier (choose “id” or “I.D” and be consistent).
- Refactor. If you encounter an issue that you can’t understand from looking at the logs alone, refactor. Add logs or make the current logs more meaningful. Logs are priceless for production readiness. Make each log count; otherwise, you’ll spend more time debugging and, even more, time refactoring the logs again.
- Don’t overdo it.
Coming Next
This concludes the first part of the series. Join me for the next part, where I tackle AWS Lambda tracing.
Special thank you goes to:
- Alon Sadovski
- Noa Gelber
- Alexy Grabov
- Koby Aharon
- Yaara Gradovitch
- and Mauro Rois.