
A serverless logs exporter. Photo by Satyakam Kanaglekar: https://www.pexels.com/photo/truck-carrying-wood-logs-11765701/
Integrating AWS CloudWatch with third-party observability tools can be a game-changer for monitoring serverless services.
This blog post will explain why you should integrate CloudWatch with a third-party observability tool in a serverless services environment.
You will also learn how to export CloudWatch logs effectively using serverless technology to third-party observability tools such as DataDog, Grafana, and others to simplify log management and provide deeper insights into your services' performance.
The Serverless Case for Exporting CloudWatch Logs
Monitoring a serverless service starts with service logs. AWS Lambda and CloudWatch have a native and transparent integration. Lambda functions output their logs to CloudWatch log groups by default. You can learn more about logging best practices in my Lambda logging best practices post.
Once the logs appear in the CloudWatch console, the next step in monitoring your service is to build a dashboard. You can learn more about dashboard building best practices in my CloudWatch monitoring best practices post.
Some companies prefer third-party observability tools such as Grafana Cloud, DataDog, and others, due to their ease of use and other advanced features.
So why should you keep using CloudWatch? Why not just output the logs directly to a third-party observability tool?
If you use serverless technology, it makes more sense to keep using CloudWatch as the default logs output. Here's why:
- Performance. Let's assume we export all logs directly to a third party and don't write to CloudWatch. Integration with these 3rd party tools might require the use of an SDK. SDKs affect Lambda function performance as the Lambda process exports the logs with an API call to the third party during the invocation.
- Less deployment dependencies. Another option to integrate with third-party tools is to use a Lambda extension (in the form of a Lambda layer - like DataDog). The lambda layer has its disadvantages which I discuss in my Lambda layers best practices post, but the major downside is that it adds another deployment time dependency.
- Easy to change. If you want to switch from one 3rd party to another (yes, it happens!), you must change ALL your functions to use a new SDK or Lambda extension—a huge pain. However, if you write all logs to CloudWatch and export them from a centralized solution in your account to a third party - switching a third party translates to changing the logs exporter while your services do not change!
To summarize, writing Lambda function logs to CloudWatch instead of directly exporting them to the third-party tool means better performance, fewer deployment dependencies, and a more effortless switch to a different third-party tool in the future, but these features come at an added cost.
Now, all that's left to do is to implement a centralized logs exporter that will send CloudWatch logs to a third party of your choice without impacting any of your services.
CloudWatch Logs Serverless Exporters
We will review several designs for a centralized logs exporter. You will deploy it in your accounts across the organization, and it will make sure the logs are exported to the third-party tool. As noted before, your serverless services are unaware of the logs exporter or the third-party tools.
As of May 1st 2025, Lambda function have a dedicated logging destination for S3 or Firehose. Thus making the CloudWatch subscription design below not needed! Each function can send its logs directly to a Firehose, and not store logs on CW, thus reducing cost!
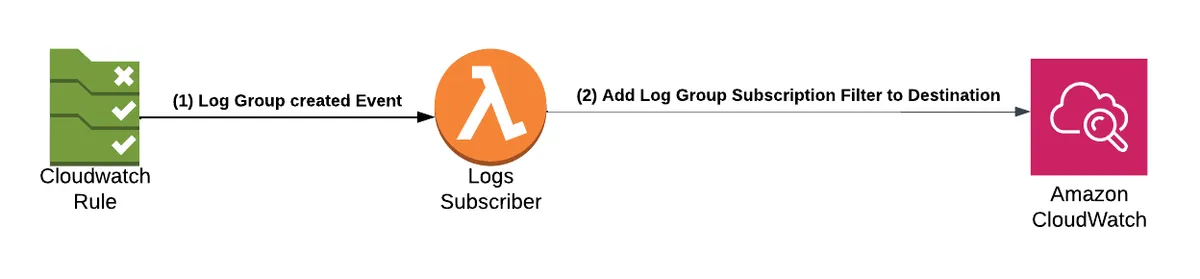
The following designs rely on a CloudWatch subscription capability to subscribe log groups to a destination, meaning CloudWatch sends log streams to a destination of your choice: Kinesis DataStream, Amazon OpenSearch, Lambda function, or Kinesis Firehose.
These are the possible options for the design entry points.
You can use subscriptions to get access to a real-time feed of log events from CloudWatch Logs and have it delivered to other services such as an Amazon Kinesis stream, an Amazon Kinesis Data Firehose stream, or AWS Lambda for custom processing, analysis, or loading to other systems. When log events are sent to the receiving service, they are base64 encoded and compressed with the gzip format.
You can add a filter to select what log groups you don't want to export. For more information, refer to the documentation.
We will review several log exporter designs, discuss their pros and cons, and how easy it is to switch between third parties.
All the designs rely on serverless architecture to keep the management and maintainability costs as low as possible.
Please note that I do not cover costs in this post. Make sure to calculate a design of your choice and match it to your needs and budget.
Kinesis Firehose
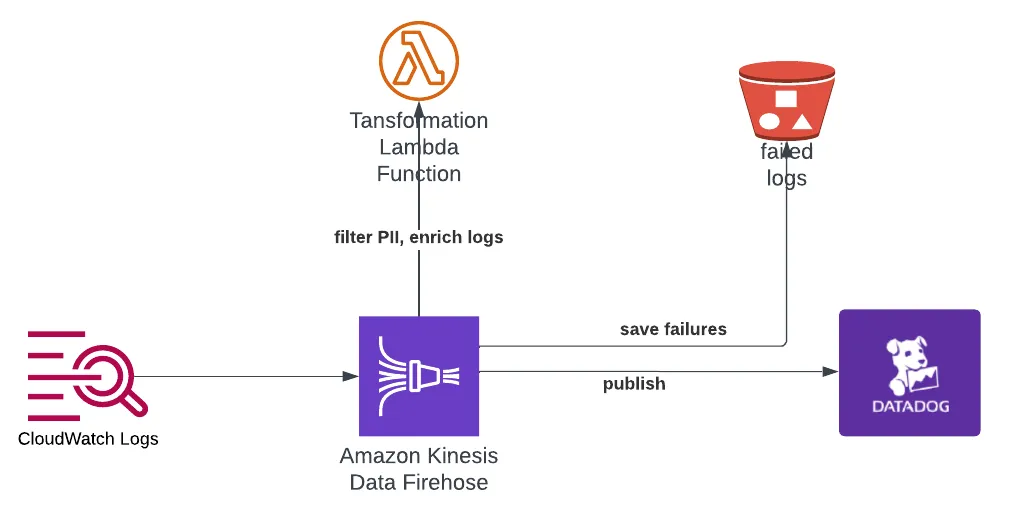
In the following design, we will use Kinesis Firehose as the entry point that receives a batch of logs. When log events are sent to the receiving service, they are base64 encoded and compressed with the gzip format, according to the documentation.
FireHose can invoke a transformation Lambda function per batch. The Lambda function can process the batch, alter it, and return the processed output to Firehose. The function has five minutes per batch to process it. The transformation Lambda provides several powerful capabilities that you can implement:
- Filter out logs from the batch, thus controlling which logs you export to a third party.
- Enrich logs with metadata (stack tags, etc.)
- Remove personal identifiable information (PII) from logs before sending them to a third party. You have total control.
Once processed, Firehose sends the batch to an HTTP endpoint destination. You can send it to AWS observability partners such as Datadog, Dynatrace, LogicMonitor, MongoDB, New Relic, Splunk, or Sumo Logic.
Pros:
- Fully serverless solution.
- Firehose handles transformation function invocation failures.
- Excellent debug. You can configure Firehose to send failed batches to an S3 bucket. Each batch includes logs that help debug the HTTP destination failure. Refer to the Firehose HTTP troubleshooting documentation.
- Transformation Lambda function capabilities as described above.
- Easy to switch between supported 3rd parties - all you need to do is change the destination URL (and API secret keys).
- Writing code that sends HTTPS requests and manages retries is unnecessary, as Firehose does that for you.
- All design resources support auto-scaling.
Cons:
If a response fails to conform to the requirements below, the Kinesis Firehose server treats it as though it had a 500 status code with no body. - AWS
- Firehose has a unique HTTP request/response format; not all third-party tools support it. Refer to the Firehose HTTP request/response documentation.
Kinesis DataStreams & EventBridge Pipes
One of the major cons of the previous design was that not ALL third-party observability tools are supported, for example, Grafana. The following two designs solve that and allow you to export to any third-party tool. Let's review the first design.
This design came to reality from a discussion with a fellow AWS serverless hero, Aidan Steele, who suggested EventBridge pipes as an option. Thank you Aidan!
In this example, we will subscribe our logs to Kinesis DataStreams. We will set the output of the DataStreams to an EventBridge Pipe. We cannot use Firehose as an entry point because it does not support export to an EventBridge pipe.
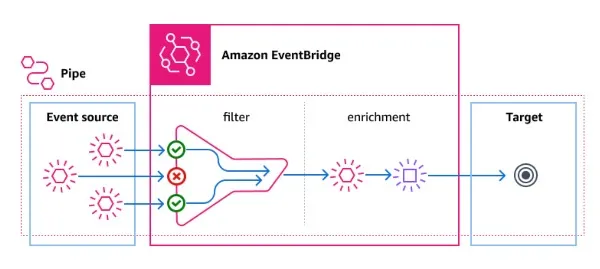
Pipes are intended for point-to-point integrations between supported sources and targets, with support for advanced transformations and enrichment. It reduces the need for specialized knowledge and integration code when developing event-driven architectures
EventBridge pipes will get a batch of logs from Kinesis DataStreams, trigger an enrichment Lambda function, and send the batch to an API destination of our choice over HTTPS.
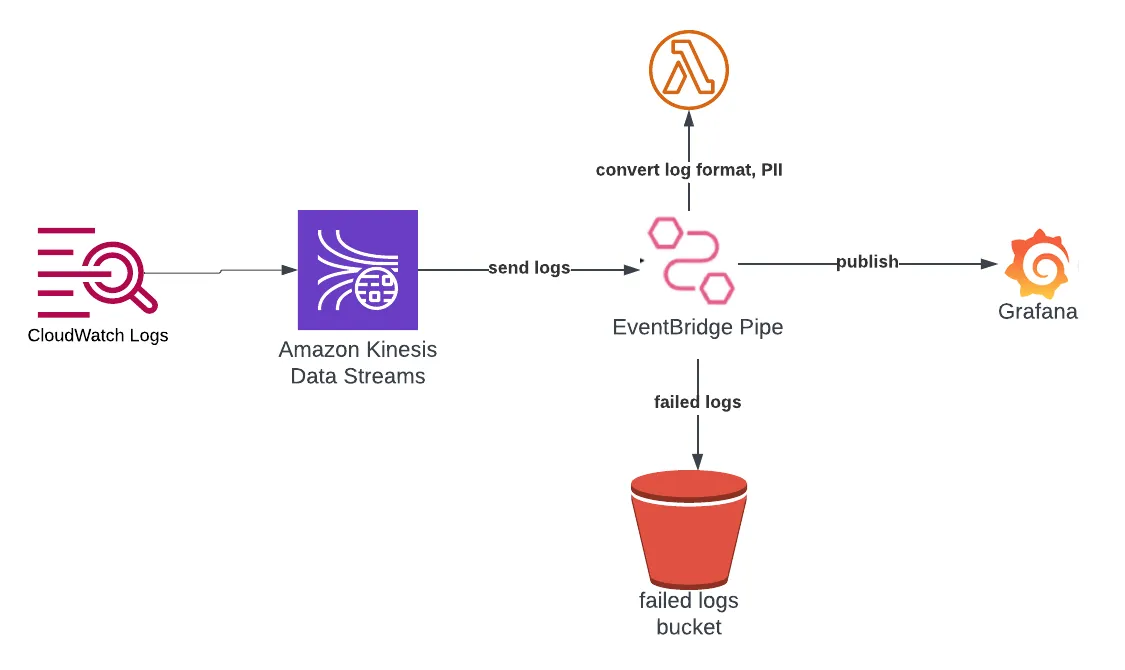
In this example, we will export the logs to Grafana.
You can use EventBridge Pipe's filter capabilities, but since the logs are gzipped, filtering logs in the enrichment Lambda is simpler.
The enrichment Lambda function will can implement similar capabilities to the transformation Lambda in the Firehose design:
- Filter out logs from the batch, thus controlling which logs are exported to a third party.
- Enrich logs with metadata (stack tags, etc.)
- Remove personal identifiable information (PII) from logs before sending them to a third party. You have total control.
- Return a payload that the third party expects to receive, i.e. the JSON payload Grafana Loki expects to receive - see the example in the docs and the image below:
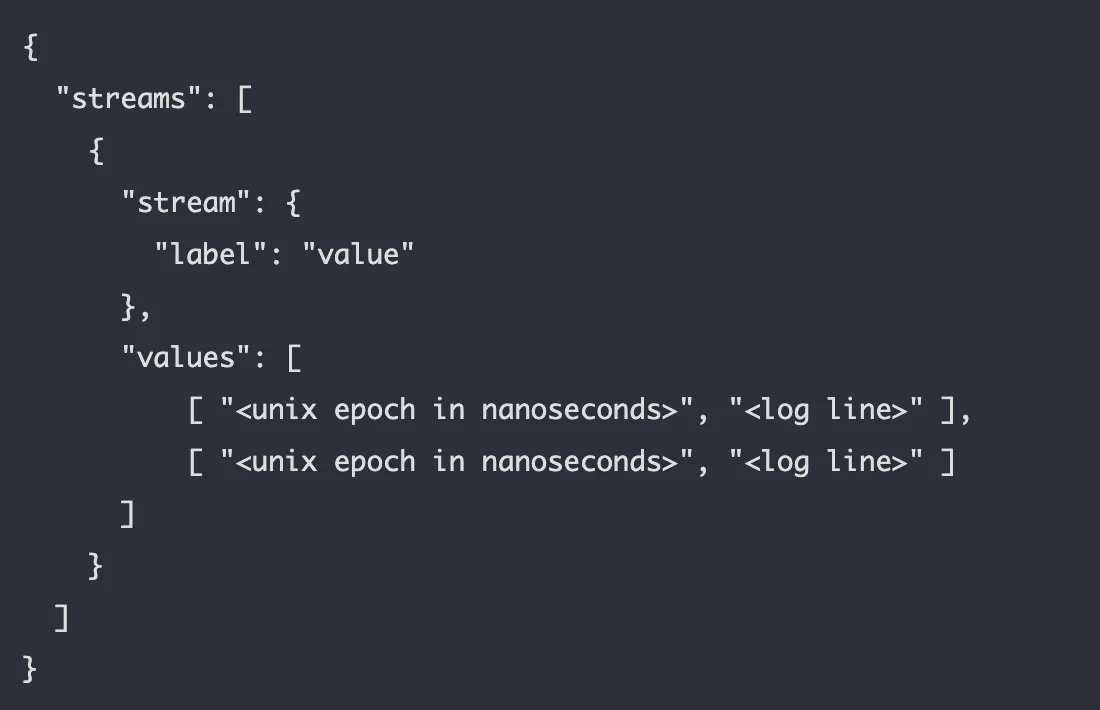
The enrichment Lambda returns the payload that contains the filtered and enriched logs in the format that a specific third party expects. The EventBridge pipe then sends the payload to the API destination.
EventBridge supports sending failures with debug information to an S3 similar to Firehose. This is a new capability that was announced in Nov 15th 2023 - https://aws.amazon.com/blogs/compute/introducing-logging-support-for-amazon-eventbridge-pipes/.
Pros:
- Fully serverless solution.
- The design supports ALL third parties via HTTP batch log exports.
- Enrichment Lambda function capabilities - filter, PII, enrichment.
- Writing code that sends HTTPS requests and manages retries is unnecessary as EventBridge Pipes handles that for you.
- EventBridge Pipes and Lambda support automatic scaling.
- Failed log batches are sent to an S3 bucket with debug information.
Cons:
- It is harder to switch between third parties - you need to change the Pipe API destination and rewrite the enrichment function to match the payload of the other third party.
- KinesisData Streams can cost more than Firehose if you don't select the correct scale mechanism that fits your log bursts (on-demand vs. provisioned).
Kinesis DataStreams & Lambda Function
This third design replaces the EventBridge Pipes and gives you ultimate control regarding error handling and retries at the cost of extra code.
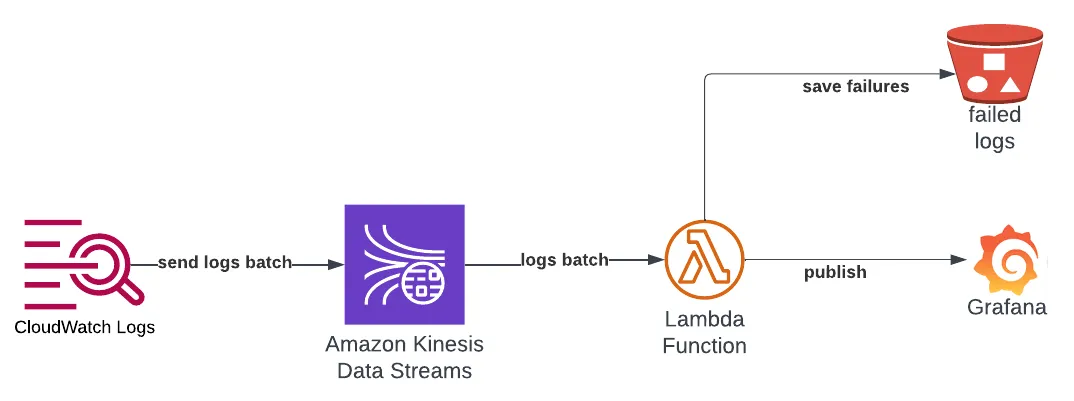
We will replace EventBridge Pipes with a Lambda Function as described in the Lambda with Kinesis documentation.
This sole function is now required to process our logs, filter, enrich, remove PII, and send the batch to the third party with an HTTP request. It must retry, handle errors, and send failed batches or log entries to the backup S3 bucket.
If you think the function does too much, you can split the function into two with an SQS in between: function (filter, enrich, PII) -> SQS -> function (export, send failures to S3), where the second function handles the export to the third party. This design is more robust but adds latency to the export process.
Pros:
- Fully serverless solution.
- The design supports ALL third parties via HTTP batch calls.
- Enrichment Lambda function capabilities - filter, PII, enrichment.
- It offers the best debuggability since you control the critical part of the chain - the Lambda function.
- Lambda supports automatic scaling.
- Failed logs are sent to a backup S3 bucket.
Cons:
- You need to write a lot of code to get everything working.
- It is harder to switch between third parties - you need to rewrite the enrichment function to match the payload of the other third party and change the code that exports via HTTP.
- KinesisData Streams can cost more than Firehose if you don't select the correct scale mechanism that fits your log bursts (on-demand vs. provisioned).
Summary
We've covered three serverless designs to export CloudWatch logs to third parties.
Each has its pros and cons. First, select the third party that fits your observability requirements, then choose the design that can matches your third-party.
Remember to estimate the export costs and design the deployment mechanism to deploy the logs exporter across your organization. Be sure to manage it via infrastructure as code (IaC) so it is easy to deploy, manage and upgrade across the organization.